Access Design Source Code:
1)通过file—open来打开,
2)通过send to source viewer来看,
双击信号,进行driver的trace,显示在左侧的driver/load tab或者直接转到下一个scope的source code file
查找:
1)右侧tool bar
2)edit—–search,
signal的选择,
1)单击或者框选,
2)select—scope/port/signal
信号右键的功能:
1) Follow signal,相当于verdi中的connection功能。
2) Trace Driving logic/Trace loading logic
3) send to waveform/watch/Schematic/Design/Design file window
4) Create Probe,
5) Show Value
6) Set Force/Release Force/Deposit Value
在进行trace的时候,如果对象是Verilog的register或者VHDL的 variable,直接进入相应的source code
如果对象是Verilog的net或者VHDL signal,进入左侧的sidebar
在source code中可以直接进行edit,然后revoke来直接进行编译仿真。
Access Design Objects
使用design browser tab,通过filter进行scope的选择。
使用design search tab,主要来选择signal(input,output,inside)/transaction/assertion等
Creating and Managing Probes
通过probe signal,可以在仿真过程中保存signal的值,之后可以直接查看probe的signal的值。
当用户向Waveform window添加signals和scopes时,Simvision自动添加probe。
在创建probe的过程中,需要勾选include task/function,include sub-scope,disable/enable add to waveform
可以在simvision—show—probes中查看已经打开的probe,也可以进行删除操作。
probe不能对在仿真中new的变量添加,不知道probe和watch window的应用区别
Setting and managing Breakpoints
simvision中支持的breakpoint的添加方式,
1) time breakpoint, stop at specify time or time interval(delta cycle)
2) signal breakpoint, stop based on a design object
3) line breakpoint, stop at specified line
4) Condition breakpoint,
通过simulation—-Set BreakPoint—time来设置,
使用breakpoint的前提是,在编译时,必须添加-linedebug
Changing and Monitoring the value of an Object during Simulation
在verilog中只有force和deposit两种方式。前提是在elaborate时,必须有-access +w的选项。
不能force的design object:
1) Verilog memory or memory element
2) bit-select或者part-select verilog register/wire
可以通过Simulation—-Show—–Forces来显示当前已有的force
不能deposit的object:(memory可以)
1) analog signal
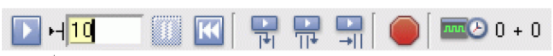
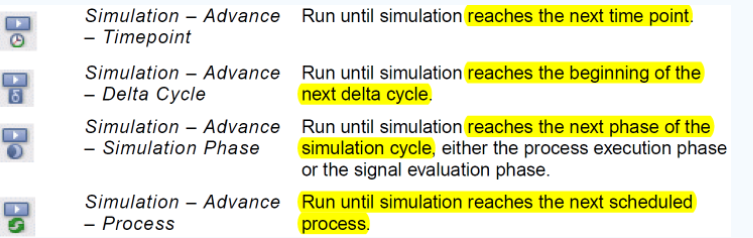
Controlling the Simulation
可以通过simulation bar来进行simulation的控制,
reset simulation:simulation time到0,设置的breakpoint和probe保留,但是force和deposit的动作都被移除。
reinvoking simulation:改变source code之后,通过reinvoke来启动simulator。
Saving and Restarting a simulation checkpoint
simulation的checkpoint可以保存design在某个simulation time的所有状态,包括:已经打开的database,设置的breakpoint
之前某个时间点的force和deposit的信号。
checkpoint的保存对large simulation的debug十分有用。
保存一个simulation check point
选择simulation—save checkpoint,点击Run Clean,为了将当前时间点的sequential code执行完毕。
从check point重新开始:
选择simulation—Restart from checkpoint,
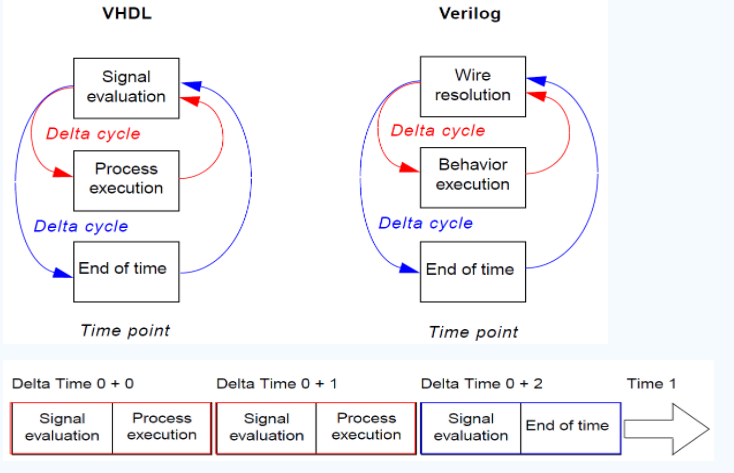
Debugging at the Delta Cycle Level
实际仿真时,并不能做到完全并行,simulator通过将每个时间点分为delta cycle并且先后调用进程来进行模拟。
在波形中,只能反映的是每个time point的最终的信号值。
delta cycle的执行过程:红色表示会发生迭代,蓝色表示最终的跳转。
Simulation Cycle Debugger的打开:
Windows—Tools—Simulation Cycle Debug
打开之后,有一个state diagram表示当前执行的point
另一个window,表示即将执行的point
直接点击某个statement就可以打开Source Browser window
Cycle Debugging的选项,
Debugging API Applications
DPI/PLI这类的API可以在simulator中,调用C/C++/SystemC这样的task。
SimVision提供GDB的环境,来直接debug API application, (环境中的gcc必须与IUS中的一致)
当调用API application时,compiling和elaborate HDL design需要加额外的option,
Eg:API调用DPI task,必须在elaborator中加入 -dpiheader,并指定一个.h文件来declares DPI task。
在simulation—systemc/c++/c debug选项,在console中加入gdb tab,并且Source Browser中加入GDB 控制。
simulator和GDB之间的交叉控制,主要通过breakpoint来设置,
Tracing Paths with the Trace Signals Sidebar
trace signals sidebar可以使能driving/loading logic,并自动的tarce所有的X value的path。
使用simvision进行driver trace操作时,simvision可以显示出force的操作,并给一个较高的grade。
为了在waveform中加入更多的内容,可以
1) probe signal,来加入更新element到波形中。
2) 在进行仿真时,加入-event option,提供更加精确的sequence time。